Admin Dashboard
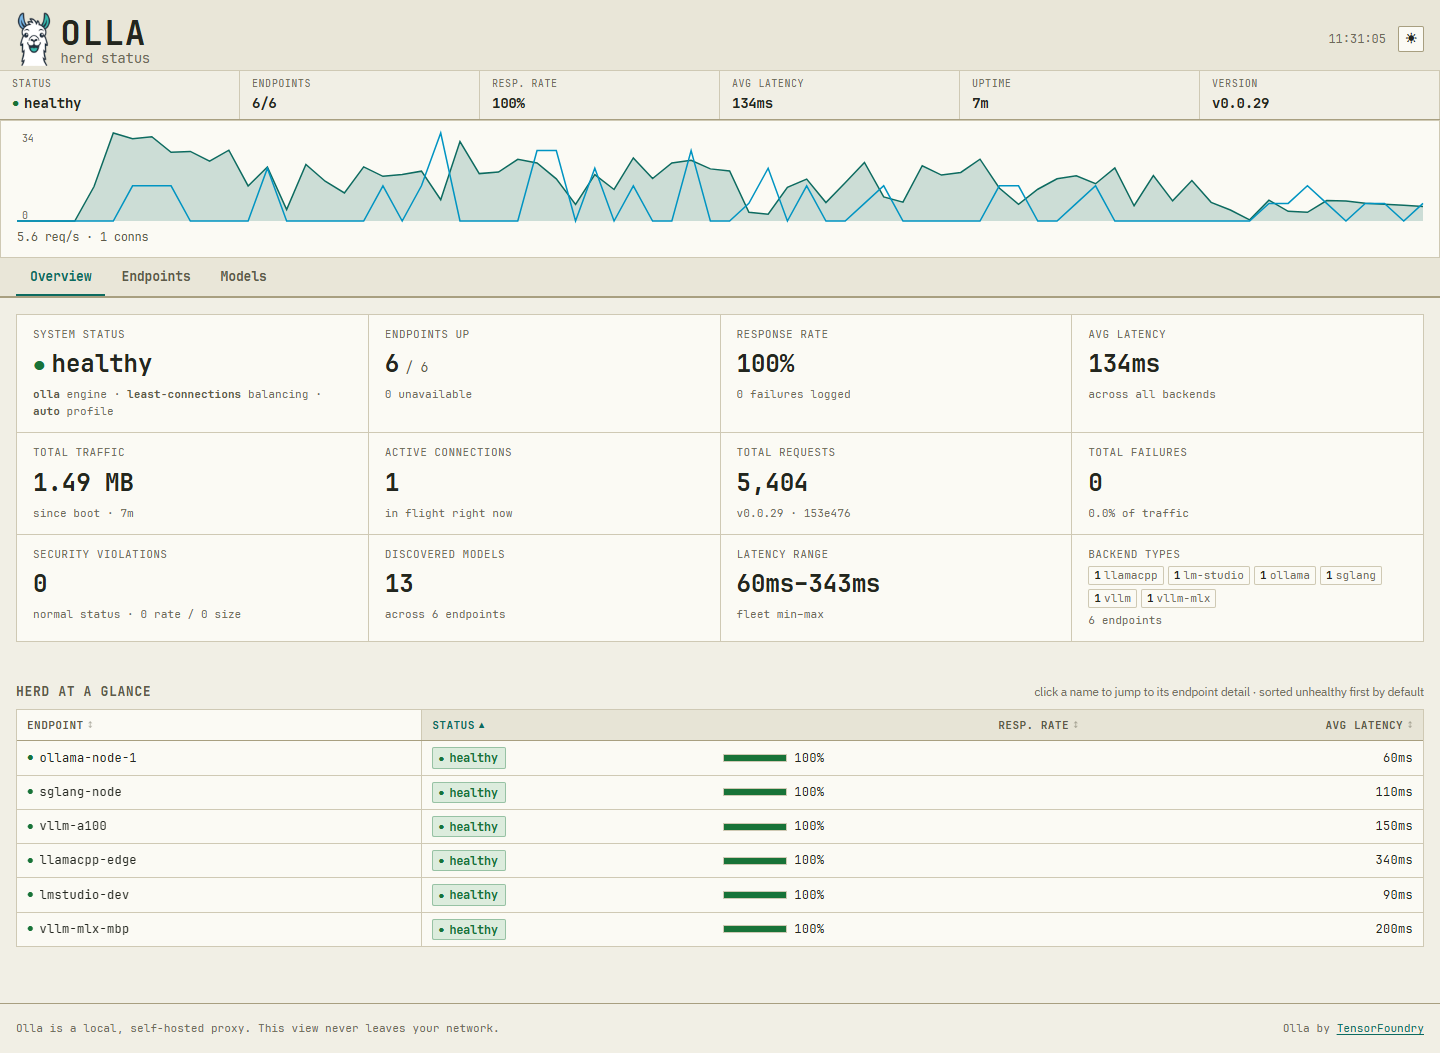
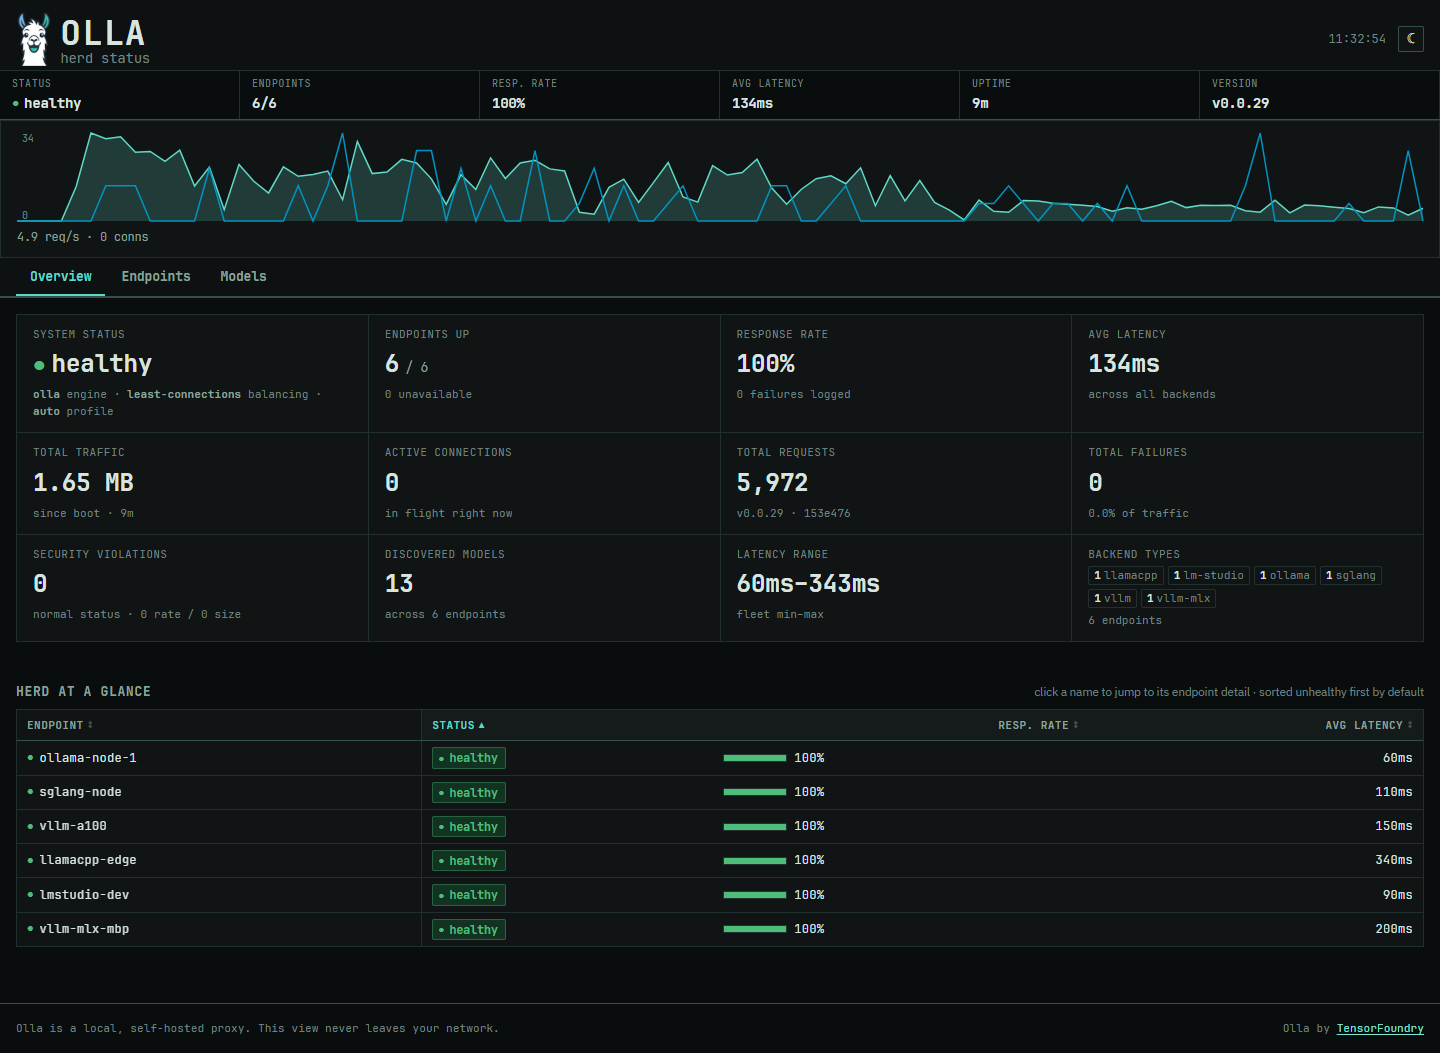
Olla ships with a read-only, single-page dashboard at /internal/ui/, embedded in the binary and served on the same listener as the proxy. It answers "is my fleet healthy", "which backend is slow" and "which models are loaded where" at a glance, without curl-ing /internal/status* and reading JSON.
| Read-only | No config editing, no endpoint control. Nothing in it changes state. |
| Polled | Fetches the same /internal/status* JSON as the CLI on a 5-15s cycle, with ETag/304 caching and gzip. No WebSocket, no push. |
| Same listener | Shares server.host and server.port with the proxy. No second port, no separate TLS posture. |
| No authentication | Access control is network-layer only. See Security model. |
Getting there
With the shipped default config, start Olla and open:
The trailing slash matters: the SPA is mounted at that exact prefix and loads its assets relative to it. localhost is in the default allowed_hosts, and an IP-literal Host such as 127.0.0.1 is always accepted, so both work out of the box. A hostname not listed in allowed_hosts is rejected, even if it resolves to an allowed IP.
The three panels
| Panel | What it shows | Backed by | Poll interval |
|---|---|---|---|
| Overview | Fleet status, success rate, average latency, traffic, connections, requests, failures, security violations, uptime, engine/balancer in use, and a live requests-per-second sparkline | GET /internal/status | 5s |
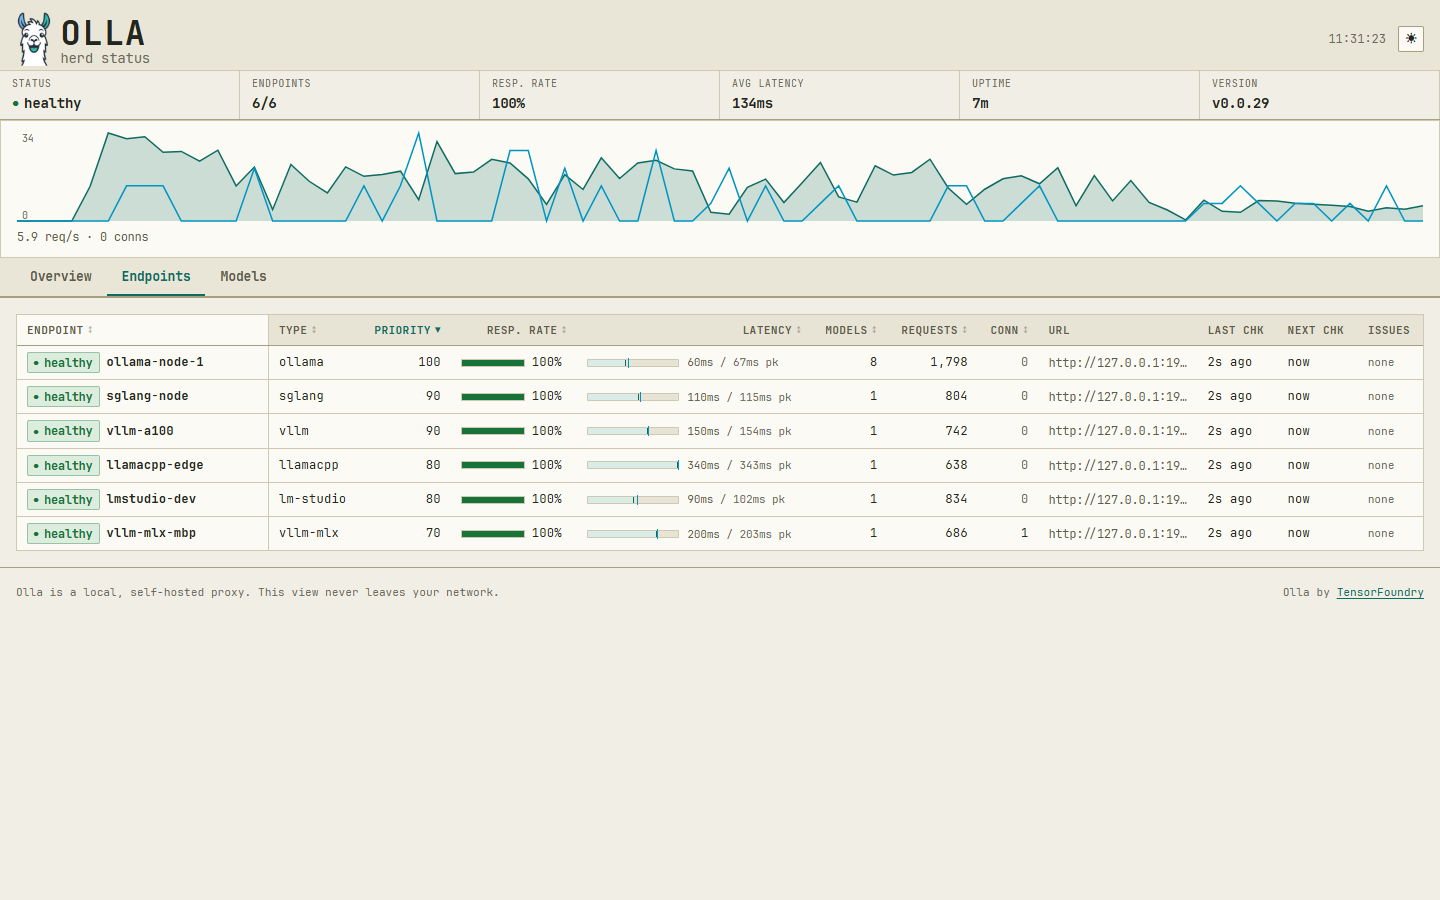
| Endpoints | Per-endpoint name, type, status, priority, success rate, latency (avg/min/max), request count, connections, model count, health check timing, sanitised URL | GET /internal/status/endpoints | 5s |
| Models | Model inventory grouped by family: name, aliases, parameter size, quantisation, size on disk, hosting endpoints, last seen | GET /internal/status/models | 15s |
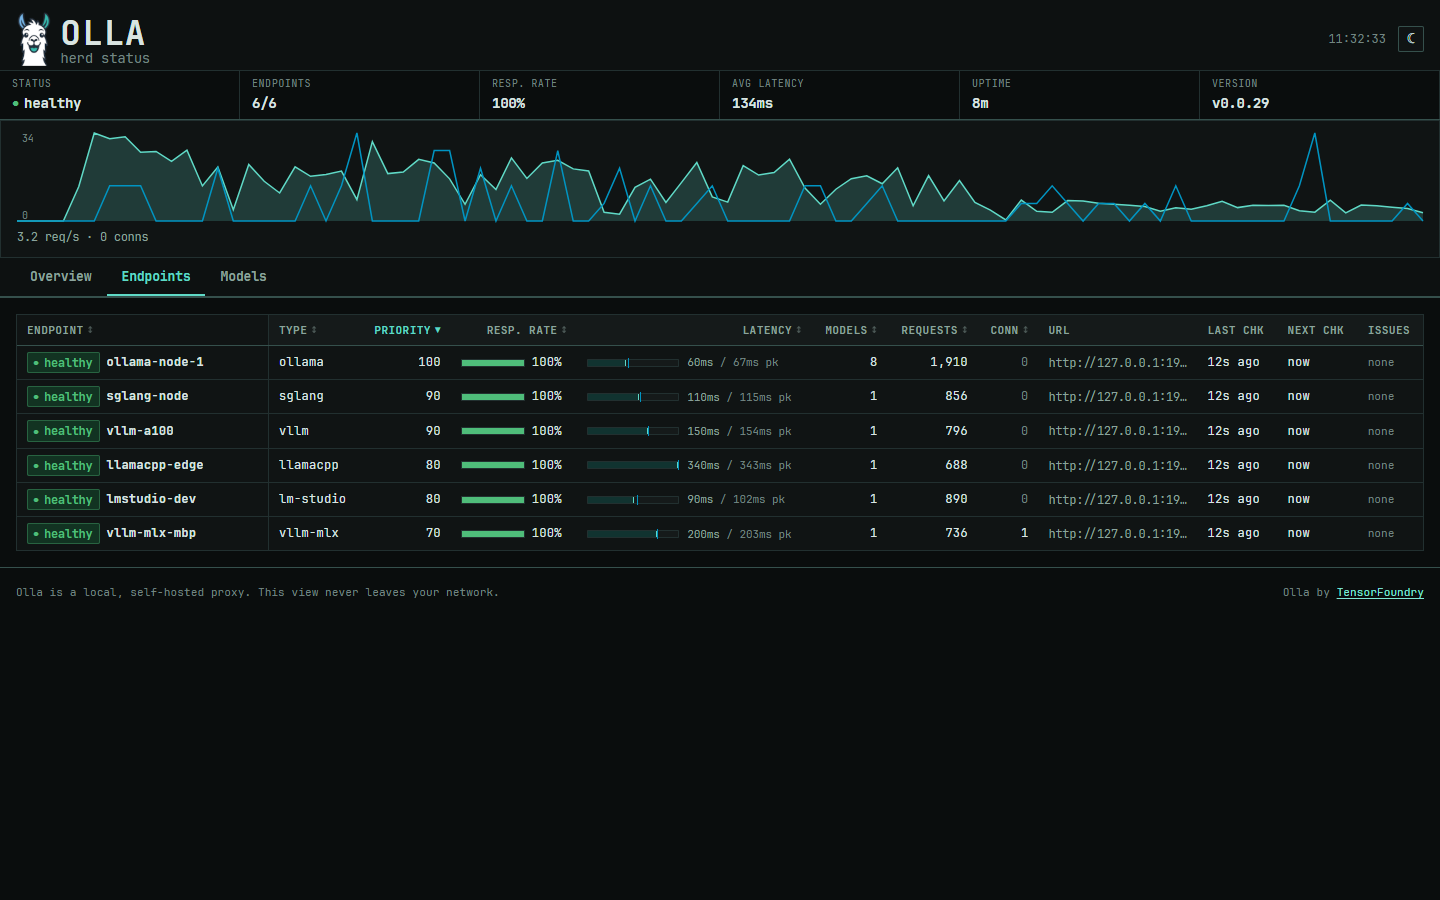
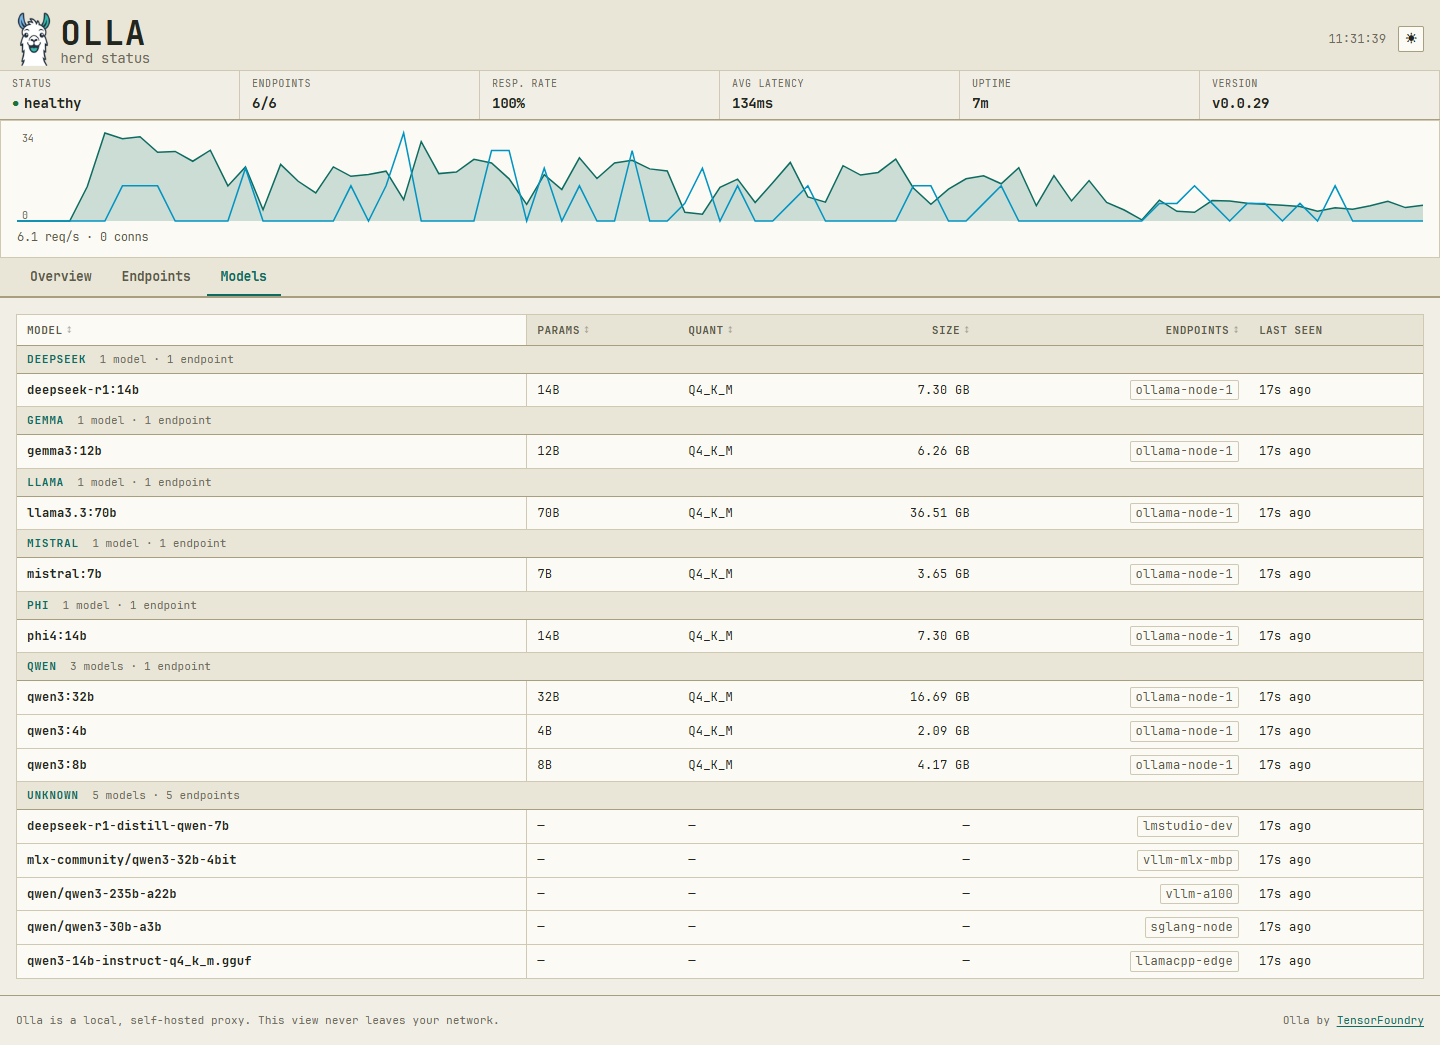
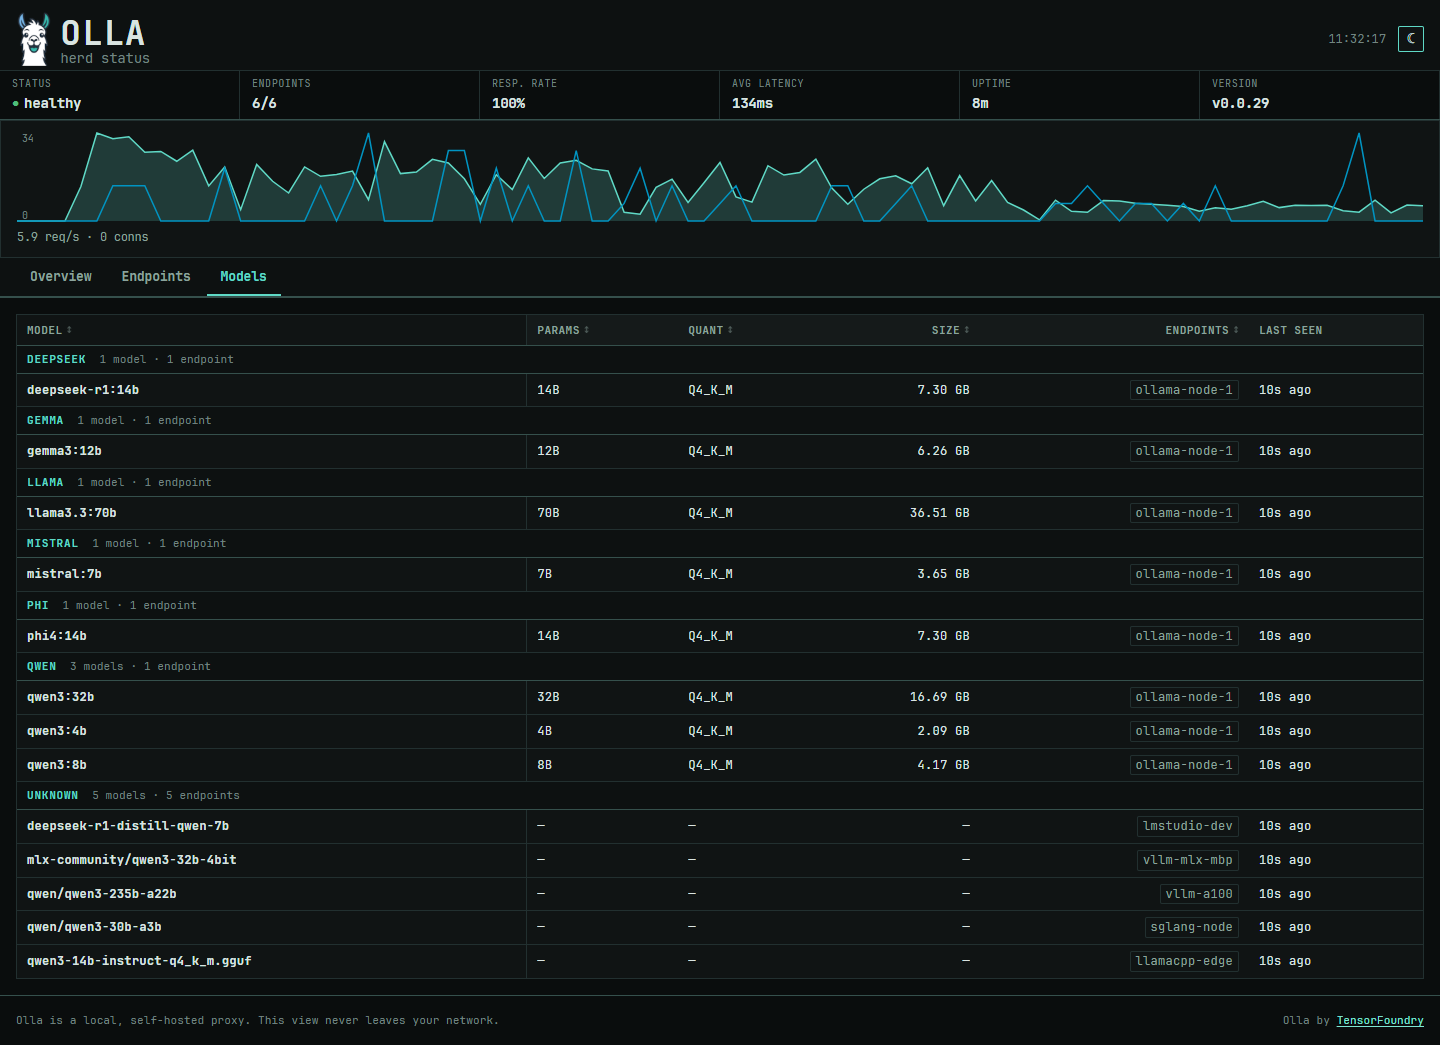
Clicking a model's host jumps to that endpoint's row in the Endpoints panel. The active panel and any selected endpoint live in the URL hash, so refreshes and shared links restore the same view. The theme follows the browser's light/dark preference, with a toggle to override it.
Polling is jittered so multiple open tabs don't fire in lockstep, backs off while the tab is hidden, and flags a panel as stale when its data is older than expected.
Two columns are deliberately absent: circuit-breaker state (the breaker only trips on health probes, so it would under-report live failures) and per-model traffic (the proxy engines don't record per-model counts).
The frontend targets current evergreen browsers; older browsers are untested. Building the SPA is covered in Development Setup.
Configuration
The shipped default enables the dashboard with a loopback-only access policy:
dashboard:
  enabled: true
  access_policy:
    allowed_cidrs:
      - "127.0.0.0/8"
      - "::1/128"
    allowed_hosts:
      - "localhost"
  gate_internal_api: false
enabled: false is a genuine off switch: no /internal/ui/* routes are registered and requests get the default 404, so the mount point is not discoverable when disabled.
| Field | Type | Default | Description |
|---|---|---|---|
dashboard.enabled | bool | true | Whether /internal/ui/* routes are registered |
dashboard.access_policy.allowed_cidrs | []string | ["127.0.0.0/8", "::1/128"] | CIDR allowlist matched against the TCP source address. Must be non-empty when enabled |
dashboard.access_policy.allowed_hosts | []string | ["localhost"] | Hostname allowlist matched against the Host header (port stripped, case-insensitive). May be empty: IP-literal Hosts are always accepted |
dashboard.gate_internal_api | bool | false | Reserved for a future release that extends access_policy to the rest of /internal/*. Inert today: setting it true logs a startup warning and changes nothing |
Startup fails if allowed_cidrs is empty or a CIDR does not parse.
Nest fields under access_policy, not directly under dashboard
Olla silently drops unknown config keys. If you put allowed_cidrs directly under dashboard: instead of dashboard.access_policy:, Olla falls back to the loopback-only default without complaint, and you find out when access is refused.
Widening access
LAN access
Add the client subnet, plus any non-IP hostname you will type into the browser:
dashboard:
  enabled: true
  access_policy:
    allowed_cidrs:
      - "127.0.0.0/8"
      - "::1/128"
      - "10.0.1.0/24"
    allowed_hosts:
      - "olla.internal.example.net"
  gate_internal_api: false
Browsing by IP (http://10.0.1.5:40114/internal/ui/) needs no allowed_hosts entry; browsing by hostname does.
Docker
The published image ships ready to go: it binds 0.0.0.0 and the dashboard's allowed_cidrs is pre-widened to the private ranges (10.0.0.0/8, 172.16.0.0/12, 192.168.0.0/16), so a request arriving through a published port - which comes from the Docker bridge gateway, not loopback - is accepted. The dashboard loads with no extra configuration:
docker run -p 40114:40114 ghcr.io/thushan/olla:latest
# then open http://localhost:40114/internal/ui/
services:
  olla:
    image: ghcr.io/thushan/olla:latest
    ports:
      - "40114:40114"
    # No volume required for the dashboard. Mount one only to customise the
    # config; it lands at the first path in Olla's config search order, so it
    # overrides the baked-in container defaults.
    # volumes:
    #   - ./olla.local.yaml:/app/config/config.local.yaml:ro
The Host check is unchanged, so reaching the container by a non-IP hostname (from another compose service, or via a DNS name on your LAN) still needs that name in allowed_hosts. localhost and any IP literal work as shipped.
Getting a 403 in Docker?
That may happen when you mount a config whose allowed_cidrs is still loopback-only. The 403 body names the source IP and Host Olla saw: 172.17.0.1 on native Linux Docker, something in 10.0.0.0/8 on Docker Desktop. Add that subnet - confirm it with docker network inspect bridge - to allowed_cidrs. Do not reach for allowed_cidrs: ["0.0.0.0/0"], which opens the dashboard to anyone who can reach the listener.
Security model
The dashboard has no authentication, consistent with the rest of /internal/*. The access policy is the only control, enforced per request. Binding the listener to loopback is not an alternative: the proxy legitimately binds 0.0.0.0 (the shipped config.yaml does), and the dashboard shares that listener.
The two checks
Every request must pass both; failure returns 403 Forbidden.
- Client IP within
allowed_cidrs. The IP is the TCP source address.X-Forwarded-ForandX-Real-IPare never consulted, under any configuration. Hostheader parses as an IP literal, or matchesallowed_hosts(port stripped, case-insensitive). Any Host that parses as an IP literal is accepted unconditionally, whatever address it names - it is not checked against the connection's actual destination. This check exists to block DNS-rebinding-style hostnames, not to bind the request to a specific IP;allowed_cidrsis the real security boundary. A non-IP Host is rejected unless listed.
A failed check returns a body naming what failed and what Olla saw, with a matching Warn log line:
403 forbidden: ip not in allowed range (ip=172.17.0.1, host=172.17.0.1:40114)
403 forbidden: host not accepted (ip=10.0.1.5, host=olla.corp.example:40114)
Scope and limits
- The gate covers
/internal/ui/only. The JSON endpoints the dashboard reads (/internal/status*,/internal/health,/internal/metrics,/version) stay as reachable as they already were; gating the UI does not gate the data it renders.gate_internal_apiis reserved to close that gap in a future release. - Anyone inside
allowed_cidrswith an accepted Host can read the dashboard. Widening the CIDR is a deliberate trade of exposure for convenience. - The container image ships that trade already made. Its
allowed_cidrscovers the private ranges so the dashboard works through a published port, which also admits anyone on the same LAN. Mount a config narrowing it to the bridge subnet if the host sits on an untrusted network.
A reverse proxy on the same host defeats the loopback check
If nginx, Caddy or Traefik forwards to Olla over 127.0.0.1, every request arrives from loopback, including public internet traffic. The dashboard never trusts X-Forwarded-For, so there is no config fix: put your access control (authentication, ACLs) at the reverse proxy.
Permissive CORS exposes the status JSON
With allowed_origins: ["*"], any website a visitor's browser is on can fetch() the /internal/* JSON cross-origin. The dashboard's own gate still applies to /internal/ui/, but the data behind it is readable regardless. Do not pair permissive CORS with an ungated /internal/*.
Troubleshooting
After changing dashboard.*, restart Olla and check from the same host:
| Response | Meaning |
|---|---|
200 | Dashboard mounted and the policy admits you |
403 | Policy refused the request. The body names the failed check and the IP and Host Olla saw, so you can add the missing allowed_cidrs or allowed_hosts entry |
404 | Routes not registered: dashboard.enabled: false |
503 | Binary was built without the SPA. Run make build-web (see Development Setup) |